
At ADISRA, we believe that great software deserves great support. As more system integrators, engineers, and plant managers adopt ADISRA SmartView to build modern HMI/SCADA applications, we have received a steady stream of questions, ranging from beginner setup tips to advanced features like database integration, scripting, and rule-based expert system logic.
In this follow-up Q&A blog, we address even more of your frequently asked questions. Whether you are just getting started with ADISRA SmartView or looking to deepen your understanding of specific capabilities, this guide is here to help you work smarter, faster, and with greater confidence.
Be sure to download the latest version, ADISRA SmartView V4.1.3, now available on our website. To explore the new features and enhancements included in this release, check out last week’s blog post for a detailed overview.
Let us dive into your latest questions and the answers that can make your next project even more successful.
Q: What is the Data Watcher tool in ADISRA SmartView, and how do I use it during Runtime?
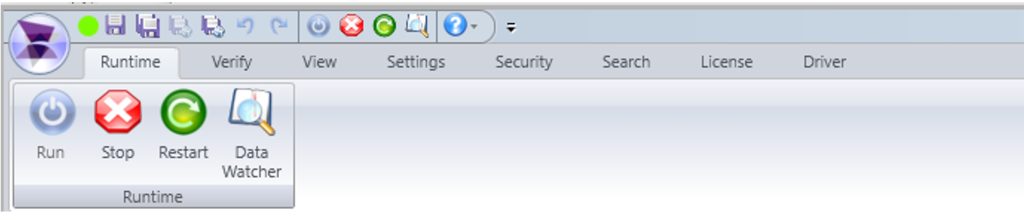
A: The Data Watcher is a diagnostic tool in ADISRA SmartView that lets you monitor tag values and update them in real time, but only while the project is running in Runtime mode. It is especially helpful for testing and debugging live data, verifying tag behavior, and adjusting values on the fly. The Data Watcher tool is found in the Runtime tab of the header ribbon in ADISRA SmartView.
Here are some of the functions:
– Connected: Indicates the Data Watcher is successfully connected to the Runtime.
– Disconnected: Appears when the Data Watcher is not connected. Make sure your project is running in Runtime mode before attempting to use this tool.
– Load All Tags: Displays all project tags and key properties. You can also manually enter tag names line by line.
– Clean Data Watcher: Clears the current tag list from the display (but does not delete any tags from the actual project).
– System Tags Checkbox: Toggle this on to view built-in system tags and their respective functionalities.
– Save Button: Export the current list of visible tags to a .csv file for documentation or reuse.
– Load Button: Import a predefined list of tags from a .csv file to quickly populate the watcher.
– Always on Top Checkbox: Keeps the Data Watcher window visible above all other windows, which can be handy for live debugging.
– Graphic Button (Trash Icon): Removes the selected tag from the Data Watcher table (again, not from the project itself).
Q: I’m seeing a “Disconnected” error in the Data Watcher. What does it mean, and how can I troubleshoot it?
A: The “Disconnected” status in the Data Watcher means it is not currently connected to the Runtime, and therefore cannot monitor or update tag values in real time. This typically occurs in the following situations:
– The project is not running in Runtime mode.
– There is a temporary communication delay or internal issue.
– The Runtime was stopped or restarted, and the Data Watcher wasn’t refreshed.
To resolve this, make sure your project is running in Runtime mode. Then, reopen or refresh the Data Watcher. Once connected, the status should change to “Connected”, allowing you to monitor and interact with live tag data.
In addition to the connection status, you can also track the quality of tag communication using the Data Watcher. Each tag displays a numeric quality code to help identify specific issues:
0 – Communication error between the tag and the Viewer Runtime
4 – Tag is not correctly configured in the driver document
8 – Tag cannot connect to the assigned driver
65 – Tag value is below the defined minimum limit
66 – Tag value is above the defined maximum limit
192 – Normal communication; tag is operating correctly
These indicators are essential for diagnosing data flow issues and ensuring your project is running as expected.
Q: What is the Tag History feature in ADISRA SmartView, and how is it organized in the development environment?
A: The Tag History feature in ADISRA SmartView enables you to store and analyze historical data from your project’s tags, essential for building trend charts, generating reports, and gaining deeper insights into system performance over time. This historical data becomes even more powerful when combined with ADISRA SmartView’s rule-based expert system, allowing you to analyze machine behavior and process efficiency to support smarter, data-driven decisions.
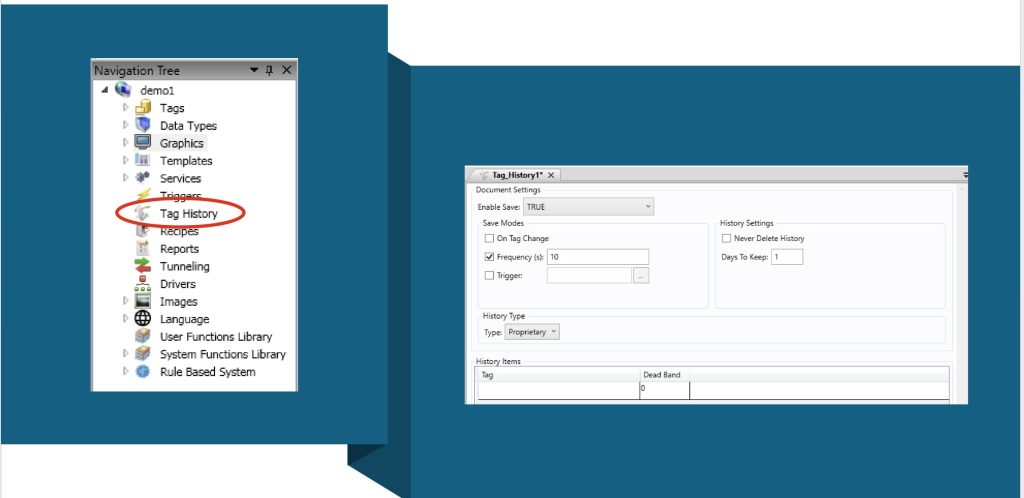
In the Engineering Environment, Tag History is managed through Tag History Documents, which are located in the Tag History folder within the Navigation Tree. These documents define which tags will be logged and how that data will be stored.
Here’s how it works:
– You can create one or more Tag History Documents in a project.
– Each document can have its own storage settings, such as:
– Storage method: proprietary file format or external database
-Retention policy: how long to keep the data
– Storage trigger: store on a schedule (time-based), when a tag changes, or based on a custom trigger
– Important: A tag can only belong to one Tag History Document, so you’ll want to group tags based on similar storage needs.
In the main section of each Tag History Document, you define:
– The list of tags to be stored
– An optional deadband value, which filters out small or insignificant changes when using the “store on tag change” method. This helps reduce unnecessary data storage.
By thoughtfully organizing your tags and configuring the right storage method, you can ensure that your system captures the data you need without overwhelming storage resources.
This feature makes it easy to build historical trends, perform diagnostics, and support long-term analysis, critical for any modern industrial automation system.
Q: What features are available in ADISRA SmartView Trends, and will it be possible to export data from them?
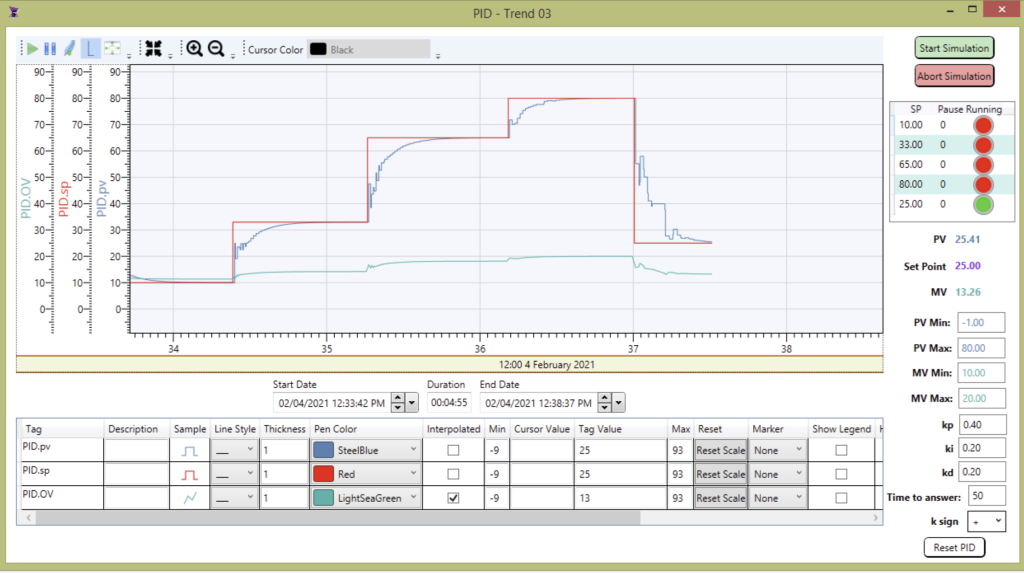
A: Great question! The ADISRA SmartView trend object is used to display the historical data of one or more tags over a certain period of time. The user also has the option to edit how the information is displayed by editing the plot line style, the period of time the object is displaying, zooming in, and so much more. Trends in ADISRA SmartView are continuously evolving to meet the demands of modern industrial applications. As of the current version, ADISRA SmartView offers a rich set of trend visualization tools designed for flexibility, usability, and advanced data analysis.
Here’s a breakdown of the key features currently available:
– Customizable Background: Easily set background color and style for better readability or branding.
– Dynamic Pens: Add or remove pens (data lines) dynamically during Runtime or configure them ahead of time.
– Multiple Scales: Use one or more Y-axis scales for different data sets.
– Flexible Line Styling: Configure line color, style, and thickness for each pen.
– Timestamp Configuration: Display or hide the timestamp area and define initial start and end dates.
– Toolbar Controls: Includes interactive tools like Run/Stop, Zoom In/Out, each of which can be shown or hidden.
– SPC (Statistical Process Control) Options: Calculate and display Max, Min, Average, and Standard Deviation directly within the trend.
– Data Source Flexibility: Trends can pull data from various sources, including CSV files and databases, giving you the ability to visualize historical or real-time information.
You can check out a Trend demo on our website here that shows how to dynamically add pens to a Trend object using scripts. The scripting feature gives you full control over pen configuration, including line thickness, color, marker style, Statistical Process Control (SPC) options, legend visibility, and interpolation methods, making it easy to customize trends to fit your application’s needs.
Q: Can I export data from the Trend tool?
A: Yes, ADISRA SmartView includes a built-in capability to export trend data. You can export any selected time range to a file or database for further analysis, documentation, or reporting. This functionality allows you to generate professional reports and retain historical data outside the runtime environment, making it easier to share insights, track performance, or meet compliance requirements.
Q: I want to deploy ADISRA SmartView on Linux. Is that possible?
A: Yes, absolutely! ADISRA SmartView Runtime runs seamlessly on both Linux and Windows, giving you flexibility in how and where you deploy your applications.
The runtime environment, known as RunTimeLnx, supports a wide range of popular Linux distributions, including:
– Ubuntu
– Mint
– CentOS
– Debian
– Alpine
And many more.
If you are using a specific Linux variant and want to confirm compatibility, feel free to reach out to our team at info@adisra.com.
How It Works
ADISRA SmartView is structured into three main components:
– Development Environment – This runs exclusively on Windows. It is where you design and configure your application.
– Runtime – This can run on Linux or Windows, depending on your deployment environment.
– Viewer – Available in Local Viewer, Remote Client, and Web Client formats, it allows you to interact with your project from any device.
Deploying to Linux – Step-by-Step
– Develop on Windows: Use the ADISRA SmartView Engineering Environment to build your application.
– Save as HTML5: Before transferring, save the project in HTML5 format to ensure compatibility with the Linux Runtime.
– Transfer the Application: Make sure your Linux machine is on the same network as your Windows development system. Then use the Remote Management Tool to seamlessly transfer files to the Linux box.
– Run Locally or Remotely: The Linux Runtime supports both:
– Remote Viewer connections via port 9002
– Web Viewer connections via port 9003
Note: You will need Apache installed to serve pages for either viewer type, whether accessed locally or remotely.
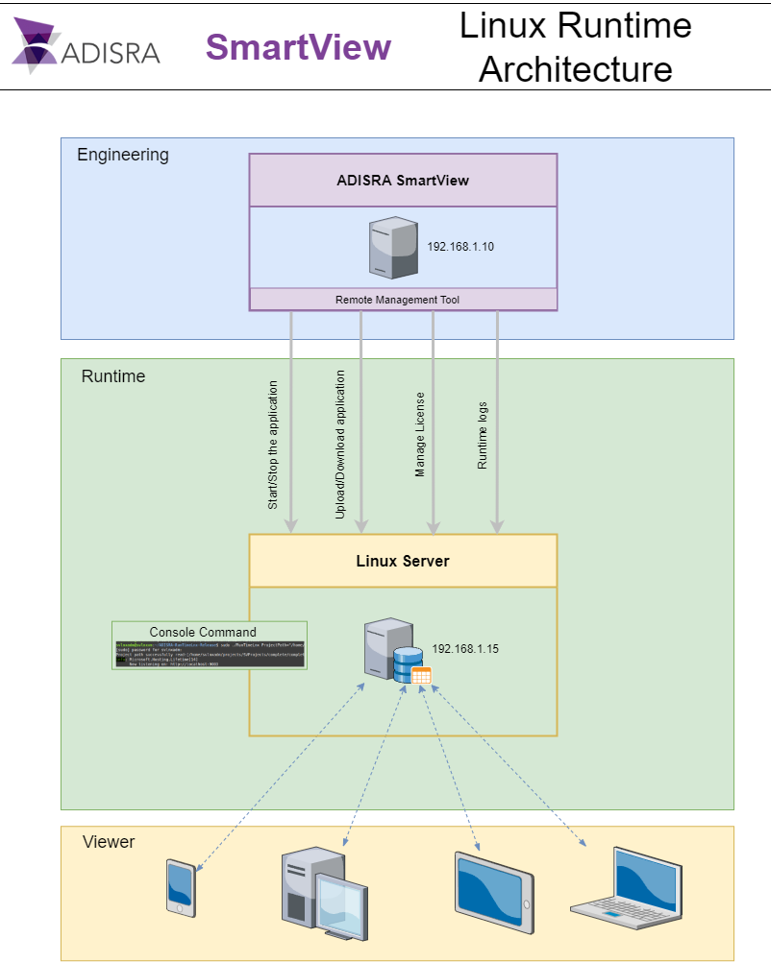
The image above illustrates the three process levels of ADISRA SmartView. The first block represents the Engineering Development Environment, which runs exclusively on Windows. This environment includes the Remote Management Tool, designed to manage ADISRA SmartView Runtime installations, whether on Windows or Linux.
Once ADISRA SmartView Runtime is installed and the Remote Management Tool Service is running on the Linux system, you can connect to it directly from the Engineering Environment. This allows you to license the Runtime, transfer applications, and start or stop the runtime process—all from a single, centralized interface.
Remote Management Made Easy
ADISRA SmartView includes a powerful Remote Management Tool that works on both Windows and Linux. Built on .NET 6, this tool allows you to:
– Upload/download applications
– Start/stop the runtime remotely
– Manage runtime logs
– Handle licensing—all without needing physical access to the Linux machine
Just make sure your operating system supports .NET 6, and you are good to go.
Conclusion
We hope this Q&A blog has given you greater clarity and confidence in using ADISRA SmartView, from monitoring live tag data with the Data Watcher to setting up robust trend analysis and deploying applications on Linux.
As ADISRA SmartView continues to evolve, we are committed to supporting you with the tools, documentation, and answers you need to succeed. Your feedback drives our development and our creativity, and we are always listening.
If you have not already, download the latest version, ADISRA SmartView V4.1.3, to explore the newest features and enhancements, including a powerful rule-based expert system and enhanced functionality for usability. You can download ADISRA SmartView V4.1.3 here.
If you would like to set up a private demonstration to address your specific requirement, you can schedule here.
And if you still have questions, do not hesitate to reach out to us at support@adisra.com. We may feature them in our next Q&A blog!
Join us for our upcoming webinar on July 24th at 9:30 AM CDT to explore the latest release, ADISRA SmartView V4.1.3, our powerful HMI/SCADA platform. In this live webinar, we will walk you through the most exciting new features, performance enhancements, and productivity tools designed to accelerate your industrial automation projects.
Webinar highlights include:
– Expanded capabilities in the Rule-Based Expert System for smarter automation
– Upgrades to graphics, installer, redundancy, data grid, trend, and driver functionality
– A deeper look at what’s new—and how it can make your next project even more efficient
Have questions about ADISRA SmartView? Bring them to the session!
We will answer them live and help you make the most of everything V4.1.3 has to offer.
Reserve your spot today!
ADISRA®, ADISRA’s logo, InsightView®, and KnowledgeView® are registered trademarks of ADISRA, LLC.
Copyright
© 2025 ADISRA, LLC. All Rights Reserved.