
I recently reflected on a one-day seminar by Edward R. Tufte on The Visual Display of Quantitative Information*. One principle stood out: “Above all else, show the data.” Tufte emphasized that the primary goal of data visualization is to present information with clarity and precision, free from unnecessary clutter or distractions. This insight led me to consider how industrial automation visualizes real-time and historical data through trends—and the critical role these trends play across various applications in our industry.
Tufte advocates for maximizing data density while minimizing chartjunk—any visual element that distracts from or misrepresents the data. In HMI/SCADA systems, trends must effectively convey real-time and historical process data, enabling operators to detect anomalies, optimize performance, and make informed decisions. Applying Tufte’s principles, trending features should prioritize clean, high-resolution graphs, use colors sparingly to avoid cognitive overload, and incorporate intelligent scaling to accommodate various timeframes and process variables. His concept of small multiples—placing multiple time-series visualizations side by side—helps operators recognize patterns across different industrial processes. By integrating these design principles, industrial trending features enhance clarity, usability, and decision-making while reducing the risk of misinterpretation.
Beyond real-time visualization, historical data and trending play a vital role in SCADA/HMI systems. With the growing availability of data points and affordable storage, much of this data is now logged for long-term analysis, making it essential for understanding system performance over time. Modern SCADA/HMI interfaces seamlessly integrate historical trend analysis, allowing operators to compare past and present data within the same visualization environment. Comprehensive trend tools provide access to historical records, forming the foundation for advanced applications such as reporting, analytics, and AI-driven predictive maintenance. By following Tufte’s principles, these tools ensure that the vast amounts of collected data are presented in a meaningful and actionable way, driving efficiency and innovation in industrial automation.
Inspired by Edward R. Tufte’s principles of clarity, precision, and data density, HMI/SCADA systems incorporate real-time and historical trends, Statistical Process Control (SPC), and PID control to help operators monitor, analyze, and enhance industrial processes. ADISRA SmartView embraces these principles, delivering intuitive and powerful tools for data-driven decision-making.
Why Do HMI/SCADA Packages Include Trending Capabilities?
In industrial automation, understanding data over time is just as crucial as monitoring it in real-time. HMI/SCADA packages incorporate trending capabilities to help operators and engineers visualize historical and live data, making it easier to detect patterns, identify anomalies, and predict future performance. These features go beyond momentary system status, offering insights that improve operations and decision-making.
HMI/SCADA packages include trending capabilities for several key reasons:
– Real-time data visualization: Enables operators to monitor process variables and system performance over time.
– Historical analysis: Provides access to past data, helping operators identify trends and optimize processes.
– Predictive maintenance: Helps visualize equipment performance trends, allowing proactive maintenance to reduce downtime and enhance reliability.
– Process optimization: Allows operators to compare current performance with historical benchmarks to identify inefficiencies.
– Anomaly detection: Helps spot deviations from normal operating conditions, enabling faster responses to potential issues.
– Decision support: Provides valuable insights for quicker, data-driven decision-making.
– Performance monitoring: Enables tracking of key performance indicators (KPIs) to ensure processes operate within acceptable ranges.
– Compliance and reporting: Historical trend data supports regulatory compliance and reporting for management and audits.
By incorporating trending capabilities, HMI/SCADA packages enhance awareness, improve operational visibility, and increase productivity and efficiency in industrial environments.
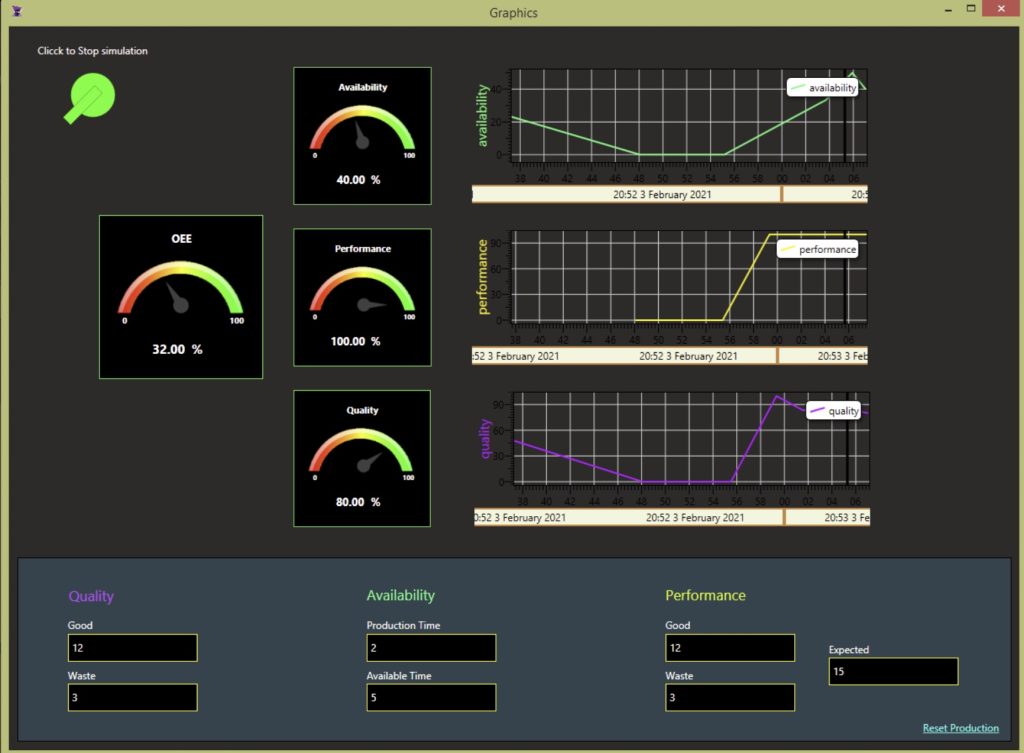
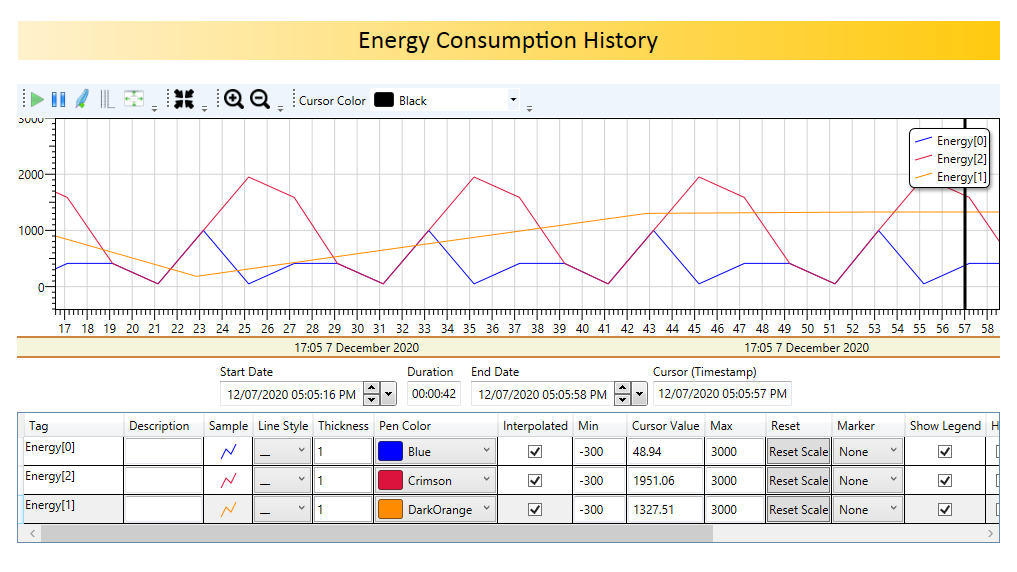
ADISRA SmartView Real-Time and Historical Trends
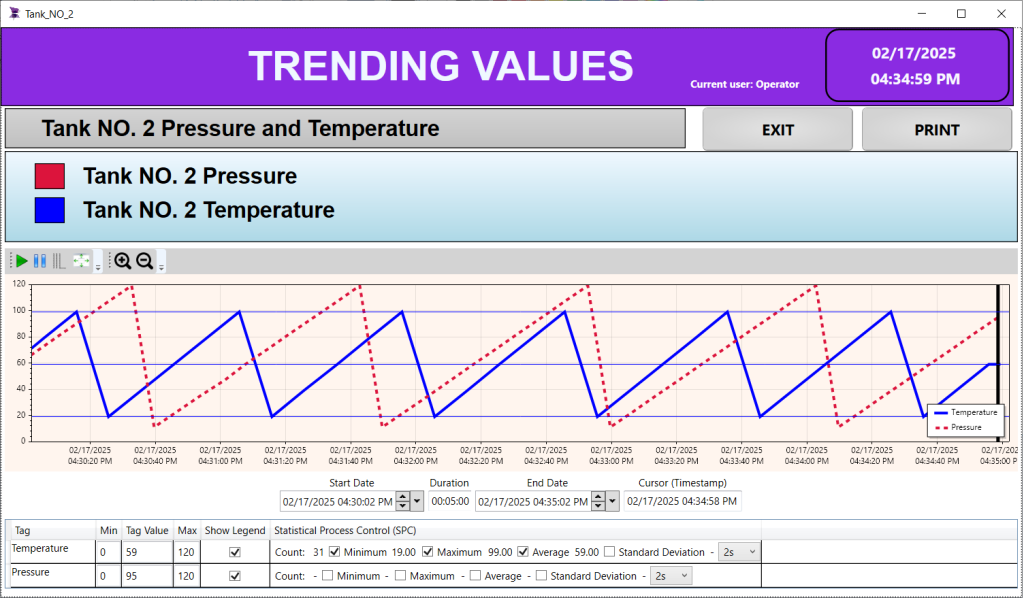
ADISRA SmartView provides comprehensive real-time and historical trend capabilities, allowing data to be logged in binary format or stored in any local or remote database. Enhance visualization clarity with customizable colors, filled trends, and graphic elements, making data interpretation more intuitive. Flexible display options include date/time-based and numeric (X/Y plot) trends, ensuring your application’s most effective format.
Seamlessly visualize historical and real-time data within a single timeline. ADISRA SmartView enables the simultaneous display of multiple analog and digital I/O values in graph or table formats for in-depth analysis. Trend displays highlight key metrics, including minimum, maximum, and average values with support for logarithmic scaling. Effortlessly export any data range to a file or database or generate professional reports for further analysis and documentation.
Trending modules in HMI/SCADA packages, such as those in ADISRA SmartView, require careful attention to design principles to ensure they effectively present critical information while enhancing user experience, operational efficiency, and safety. A well-designed trending module should prioritize clarity, reducing visual clutter while maximizing data density to provide meaningful insights at a glance. ADISRA SmartView achieves this by offering customizable real-time and historical trends, intuitive scaling, and flexible visualization options, including date/time-based and numeric (X/Y plot) trends. The ability to highlight key metrics such as minimum, maximum, and average values, along with logarithmic scaling and color-coded trends, helps operators quickly identify anomalies and trends in process data. ADISRA SmartView empowers users to monitor, analyze, and optimize industrial operations with greater accuracy and efficiency by integrating advanced trend analysis with an intuitive interface.
Statistical Process Control (SPC) in ADISRA SmartView
Statistical Process Control (SPC) tools and procedures offer robust capabilities for monitoring process behavior, identifying potential issues, and enhancing production efficiency. By leveraging advanced statistical and analytical techniques, SPC empowers operators to detect variations early and take corrective action before defects arise, ensuring continuous process improvement and operational excellence.
One of the most widely used SPC tools available in ADISRA SmartView is the control chart, originally developed by Walter Shewhart in the early 1920s. Control charts provide a visual representation of process data, helping users identify unusual events—such as significantly high or low observations—compared to normal process performance.
Control charts differentiate between two types of process variation:
– Common cause variation – inherent to the process, occurring naturally over time.
– Special cause variation – resulting from external factors, signaling that the process is out of statistical control.
SPC techniques have been widely adopted across industries in recent years, particularly as key components of quality improvement methodologies like Six Sigma. These methodologies help organizations achieve higher efficiency, consistency, and reliability in their operations.
Example of a Control Chart in Industrial Automation
Imagine a manufacturing facility that produces metal components for automotive engines. A key quality parameter in this process is the diameter of a machined shaft, which must remain within a strict tolerance of 50.00 ± 0.05 mm to ensure proper assembly.
The facility implements Statistical Process Control (SPC) using a control chart in ADISRA SmartView to monitor this process. Operators take periodic measurements of shaft diameters and plot them on the control chart, which includes:
– Center Line (CL): The average shaft diameter over time (e.g., 50.00 mm).
– Upper Control Limit (UCL): The maximum allowable process variation before intervention is needed (e.g., 50.05mm).
– Lower Control Limit (LCL): The minimum allowable process variation (e.g., 49.95 mm).
Control charts used in Statistical Process Control (SPC) embody many of Edward R. Tufte’s principles for effective data visualization, particularly his emphasis on clarity, precision, and data density. Tufte’s concept of small multiples—side-by-side comparisons of time-series data—helps identify trends and variations. In SPC, multiple control charts can be used for different process variables (e.g., temperature, pressure, or product dimensions), allowing operators to compare patterns across datasets and detect correlated issues across production stages. By following Tufte’s design principles, control charts in ADISRA SmartView present complex manufacturing data in a visually intuitive and statistically rigorous way. They enhance operational efficiency by enabling early detection of process variations, minimizing defects, and improving product quality—all while adhering to best practices in data visualization.
PID Control in HMI/SCADA Systems
PID, Proportional-Integral-Derivative, is a fundamental control loop mechanism used in HMI/SCADA systems to regulate process variables in industrial automation. These systems play a vital role in monitoring and controlling operations across industries such as manufacturing, power generation, and chemical processing. A PID controller continuously receives feedback from the process, adjusting the control output to maintain the desired setpoint, ensuring stability, efficiency, and optimal performance.
How PID Control Works
PID control combines three key actions to achieve precise regulation:
– Proportional (P): Adjusts the output based on the current error (the difference between the setpoint and the process variable). A larger error results in a stronger corrective action.
– Integral (I): Addresses accumulated errors over time, gradually increasing the output if the process variable remains off-target, helping to eliminate steady-state deviations.
– Derivative (D): Reacts to the rate of change of the error, applying corrective action to counteract rapid fluctuations, thereby stabilizing the process and minimizing overshoot.
In a PID controller, the tuning parameters play a crucial role in determining how the system responds to errors:
– Kp (Proportional Gain): Determines the immediate response to an error. A higher Kp increases the correction strength but may lead to overshooting.
– Ki (Integral Gain): Addresses accumulated errors over time, ensuring the system reaches and maintains the setpoint by eliminating steady-state error.
– Kd (Derivative Gain): Reacts to the rate of change of the error, helping to dampen oscillations and improve system stability.
By integrating these three components and tuning the Kp, Ki, and Kd values, PID controllers provide a responsive and precise control strategy, reducing fluctuations and enhancing system performance in industrial applications.
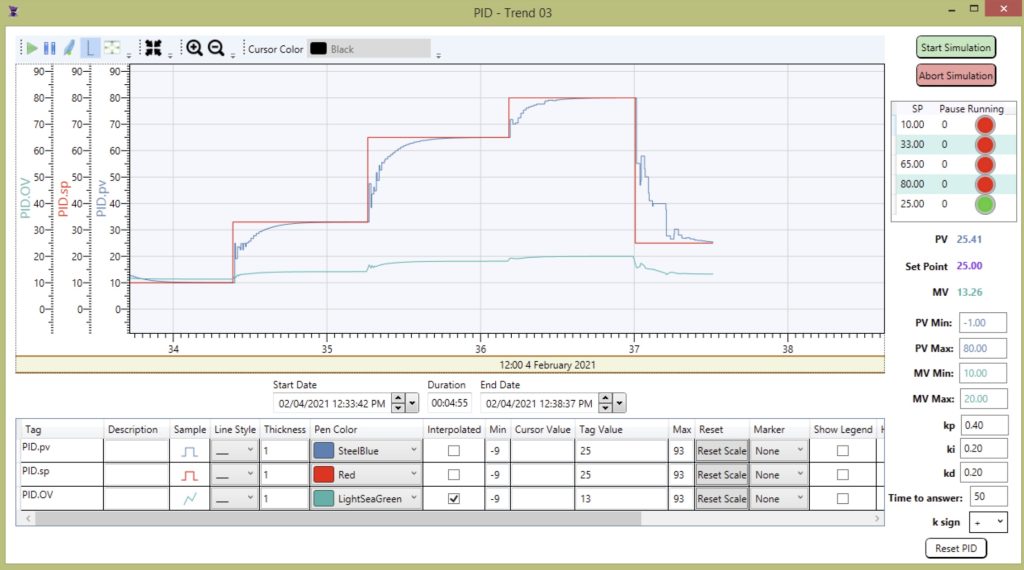
PID Control in ADISRA SmartView
ADISRA SmartView offers an example application to configure PID applications, making it easy to implement process control strategies. The application, available on ADISRA’s website here, demonstrates how to set up cycles (setpoint and pause) and fine-tune Kp, Ki, and Kd values for optimal performance.
In ADISRA SmartView:
The PID controller receives the measured process variable (PV) from a sensor.
– It determines the difference (error) between the measured PV and the desired setpoint value (SV).
– The controller computes the required manipulated variable (MV) based on the error. – The MV then acts on the final control element, influencing the process to adjust the PV and maintain stability.
By leveraging PID control in ADISRA SmartView, operators can fine-tune process automation, improve efficiency, and maintain consistent quality, ensuring reliable performance across various industrial applications.
Conclusion: Driving Efficiency Through Intelligent Data Visualization and Control
From trending tools to SPC control charts and PID automation, ADISRA SmartView applies Edward R. Tufte’s data visualization principles to industrial automation, ensuring clarity, precision, and usability. By eliminating unnecessary complexity and emphasizing real-time insights, ADISRA SmartView empowers operators to:
– Detect and respond to anomalies early.
– Optimize process performance and efficiency.
– Maintain high product quality with statistical precision.
– Reduce downtime and improve predictive maintenance strategies.
As industrial automation evolves, the ability to visualize and control data effectively remains a cornerstone of operational success. ADISRA SmartView provides the tools to maximize efficiency, enhance decision-making, and drive innovation in industrial environments.
Interested in exploring ADISRA SmartView? Visit our website to learn more, or download the software here to try it for yourself today!
* Edward R. Tufte, The Visual Display of Quantitative Information, 1983; 2nd Edition 2001.
ADISRA®, ADISRA’S logo, InsightView®, and KnowledgeView® are registered trademarks of ADISRA, LLC.
© 2025 ADISRA, LLC. All Rights Reserved.