Following our recent webinar on “From the Shop Floor to the Cloud: Maximizing OEE Everywhere”, many attendees asked insightful questions about how InsightView fits into modern manufacturing strategies. As demand for OEE software continues to grow, driven by smart manufacturing initiatives, real-time performance requirements, and the need to reduce downtime, manufacturers are evaluating how best to deploy OEE at scale across machines, plants, and enterprises.
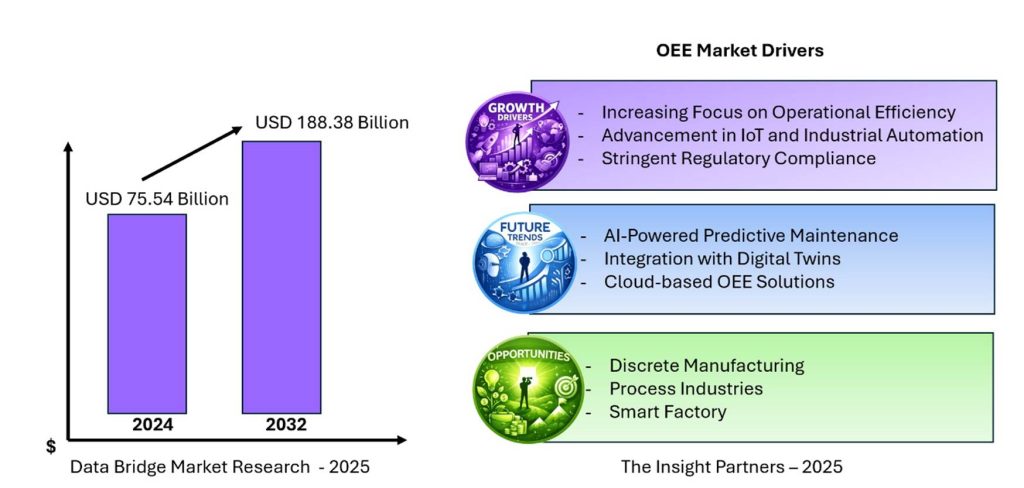
Today, North America leads the OEE market, accounting for approximately 38% of global revenue, while Asia-Pacific is the fastest-growing region due to rapid industrialization and smart-factory initiatives. At the same time, on-premise OEE deployments still account for more than half of the market, reflecting ongoing requirements for data security, customization, and legacy system integration. These trends highlight why hybrid and cloud-based OEE platforms are gaining traction.
In this blog, we address the most common questions raised during our webinar and provide clear, practical answers about InsightView. Whether you are just beginning your OEE journey or looking to expand visibility beyond the plant floor, this Q&A is designed to help you understand how InsightView can support smarter, data-driven decisions.
From OEE Metrics to Actionable Insights
Understanding OEE at this level is essential, but the real value comes from how effectively it is measured, analyzed, and acted upon. While the OEE score itself provides a powerful snapshot of manufacturing performance, it is only the starting point. To drive meaningful improvement, manufacturers must look beyond the headline number and examine the operational data that feeds it.
This is where modern OEE platforms make a measurable difference. By continuously capturing runtime data, downtime events, production counts, and quality results, OEE systems transform raw machine data into actionable insights. Instead of reacting to problems after the fact, teams gain visibility into loss patterns as they emerge, whether it is frequent short stops affecting performance, recurring changeovers impacting availability, or quality issues concentrated at startup.
Equally important is context. OEE data must be analyzed across shifts, lines, products, and facilities to uncover trends that are not visible at the machine level alone. A single asset may appear efficient in isolation, while plant-wide or multi-site data reveals systemic issues tied to scheduling, maintenance practices, or operator workflows. This broader view enables organizations to prioritize improvements that deliver the greatest operational and financial impact.
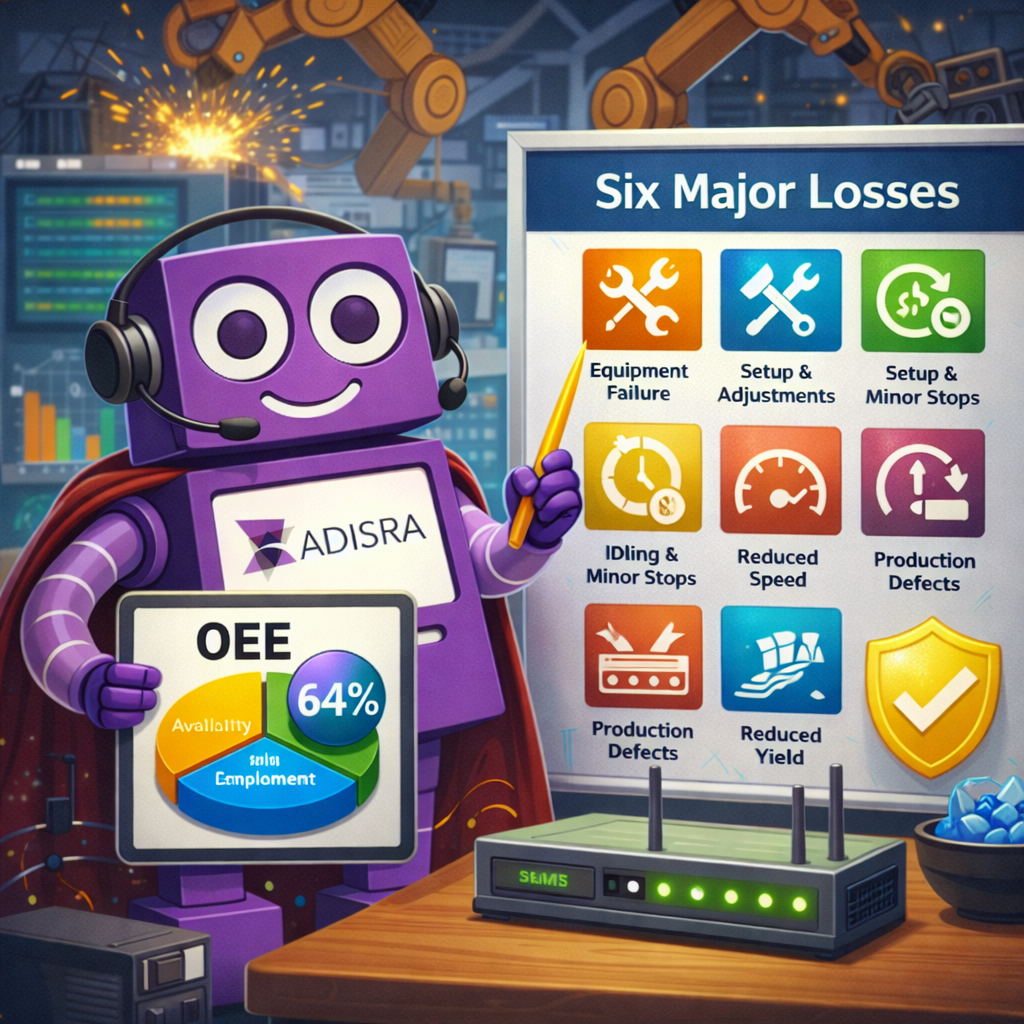
For a more in-depth discussion of the metrics behind OEE and the Six Major Losses, we invite you to explore the following previous blog posts.
- Beyond the Rearview Mirror: How AI is Transforming OEE and the Future of Manufacturing
- Maximizing Dairy Plant Performance: A Hybrid OEE Strategy From Machine to Cloud
- OEE in 2025 from KPI to AI-Driven Optimization
- Tackling the Six Major Losses to Maximize OEE in 2025
- Optimizing Manufacturing Performance Leveraging OEE and the Six Major Losses for Plant and Multi-site Efficiency with Cloud Integration
As manufacturers expand from single-machine monitoring to plant-wide and enterprise-level performance management, questions naturally arise: Where should OEE data live? How do cloud and on-premises systems work together? How can OEE scale across multiple sites without adding complexity?
In the next section, we answer these questions directly, drawing from the most common topics raised during our recent webinar, to explain how InsightView helps manufacturers operationalize OEE, from real-time visibility to actionable intelligence.
InsightView: Your Questions Answered
Since I missed the webinar, can you give me a quick overview of InsightView?
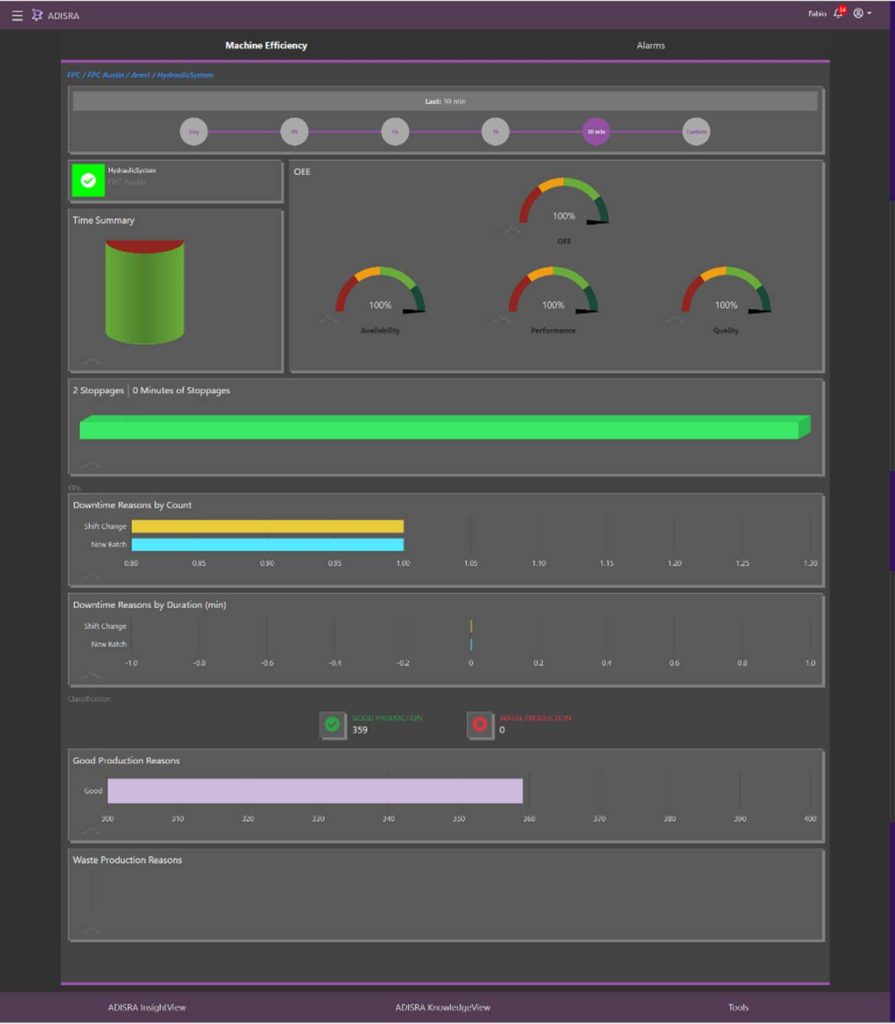
InsightView is a powerful yet intuitive analytics platform from ADISRA designed to transform production data into meaningful performance insights. It interprets machine and process data to measure productivity, providing key indicators such as Overall Equipment Effectiveness (OEE) and visibility into the Six Major Losses that impact operational performance.
Highly flexible and customizable, InsightView allows users to build dashboards tailored to their specific monitoring needs, whether tracking individual machines, production lines, or multiple facilities, making it easier to understand machine status, identify losses, and drive continuous improvement.
To catch up on what you missed, you can access the webinar video replay here and download the presentation slides here.
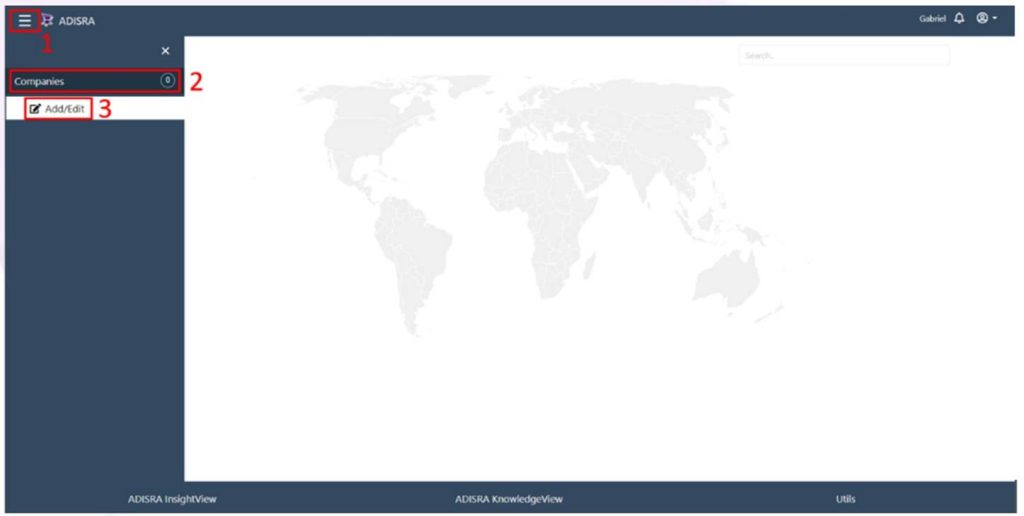
Click the navigation menu in the top-left corner of the page (1). When the menu opens, select the “Companies” tab (2), then click the “Add/Edit” button (3). Click the “+” button in the bottom-right corner of the page (4). A window will appear. Enter the company name (required), display name (the name shown in the navigation menu), and a short company description (5). When finished, click “Save.”
My company has multiple locations. Does InsightView support multi-site operations?
Yes. InsightView is designed to support companies with multiple locations, making it easy to organize, monitor, and analyze performance across sites from a single platform.
You begin by defining your company and adding individual sites using a simple, menu-driven interface. Each site can be configured with a site name, display name, description, and geographic location. By assigning latitude and longitude values, InsightView can accurately place each site on a map, enabling intuitive navigation and quick access to site-level performance data.
Once sites are defined, you can further structure each location by creating areas and assigning the assets to be monitored. This hierarchical approach, company, site, area, and asset, allows InsightView to scale naturally as your organization grows, while maintaining clear visibility from individual machines all the way up to enterprise-level performance.
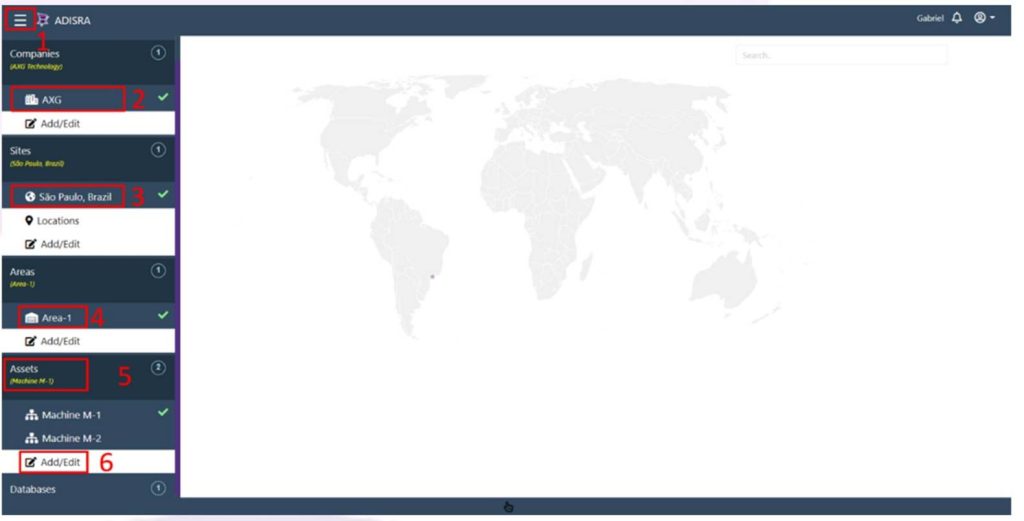
Open the navigation menu (1). Select the company (2), site (3), and area (4) by clicking their names. Click the “Assets” tab (5), then click the “Add/Edit” button (6). Click the “Tags” button (7) for the selected asset. A window will appear.
Once my assets are defined, how does InsightView connect to data and calculate OEE?
After an asset’s location and structure are defined, the next step is telling InsightView where to retrieve the data that drives analytics and OEE calculations. In InsightView, these data points are referred to as tags, and they are typically sourced from an external database.
Users begin by configuring one or more database connections at the company or site level. InsightView supports a wide range of industrial and enterprise database servers, including SQL Server, PostgreSQL, MySQL, Oracle, and others, enabling seamless integration with existing data architectures. Once a database connection is defined and saved, it becomes available as a trusted data source for the application.
With the database in place, tags are then mapped to each asset. Tag mapping defines which database values represent runtime events, production counts, quality results, ideal rates, shifts, and batch information. InsightView separates this into two logical areas:
– General Tag Mapping, used for monitoring any asset-related data
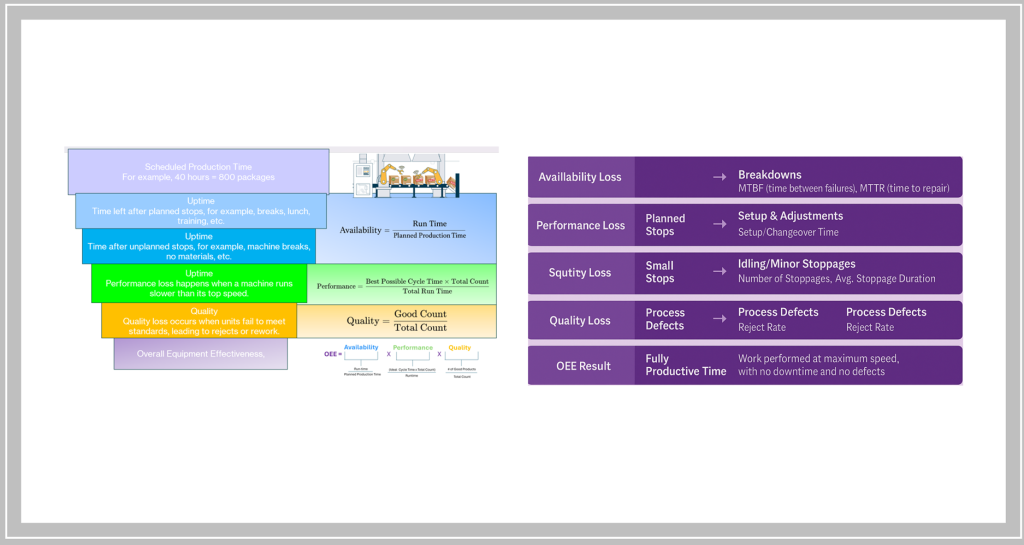
– OEE Mapping, which links the specific tags required to calculate OEE and the Six Major Losses
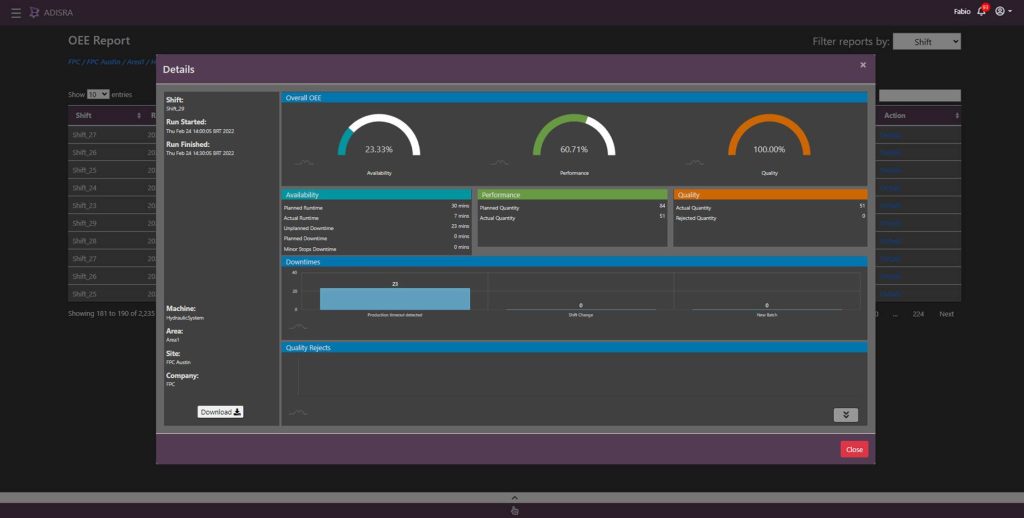
The OEE Mapping includes downtime events, production output status (good, reject, startup reject), ideal production rates, planned quantities, shift timing, and batch details. By mapping these tags to the appropriate database tables and timestamps, InsightView can accurately calculate Availability, Performance, Quality, and loss categories for each shift, each batch, or across longer time horizons.
This structured, database-driven approach allows InsightView to work with real production data already being collected, eliminating the need for duplicate data entry while ensuring consistent, scalable OEE calculations across machines, lines, plants, and multiple sites.
Does InsightView support real-time data, historical analysis, or both?
InsightView supports both real-time monitoring and historical analysis, allowing manufacturers to move seamlessly from immediate visibility to long-term performance improvement. As new data is written to the database, InsightView continuously retrieves and processes the latest values, keeping dashboards and KPIs up to date with current operating conditions.
At the same time, InsightView stores and analyzes historical data to reveal trends over time, across shifts, batches, days, or more extended production periods. This enables users to identify recurring downtime patterns, performance degradation, quality issues, and opportunities for optimization that may not be visible in real time alone.
By combining real-time insight with historical context, InsightView helps teams shift from reactive firefighting to proactive decision-making. Operators gain instant awareness of what is happening now. At the same time, engineers and managers can analyze past performance to prevent future losses, improve scheduling, refine maintenance strategies, and drive continuous improvement across sites.
How are dashboards and KPIs customized for different roles in InsightView?
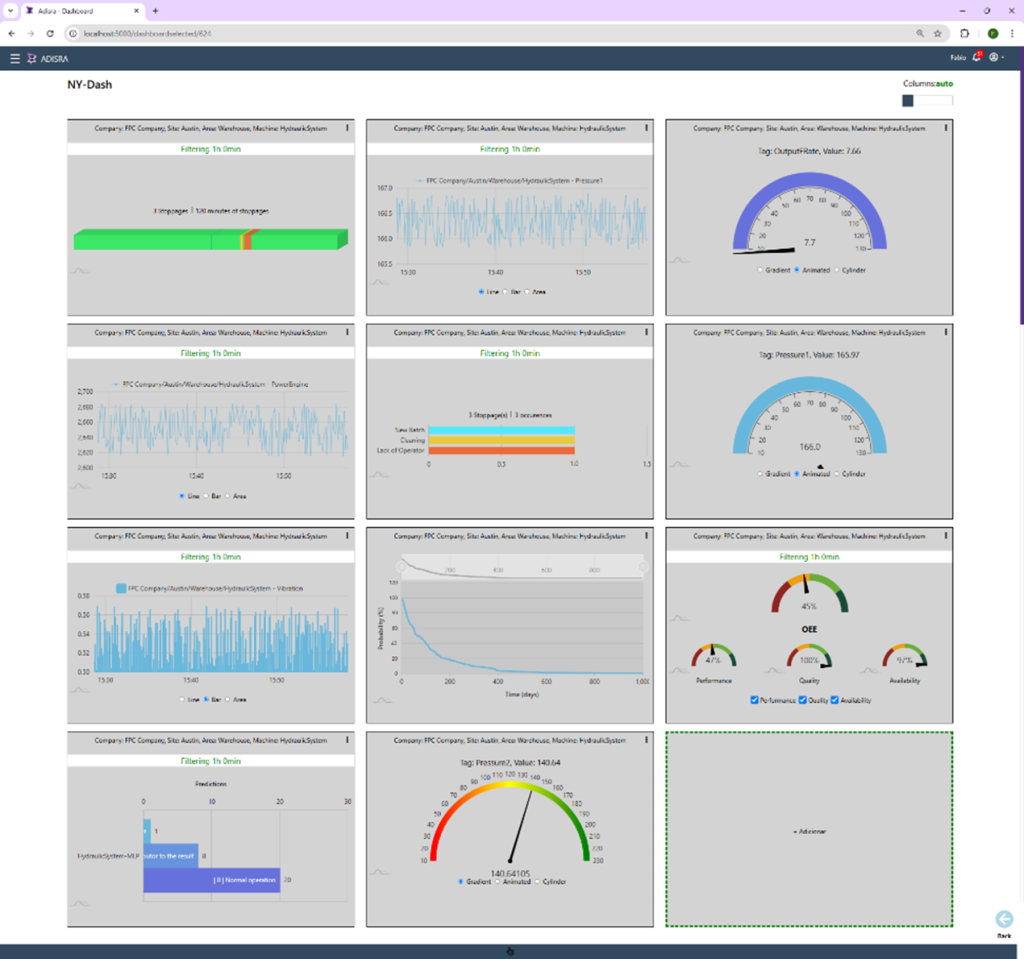
InsightView is designed with role-based visibility in mind, recognizing that operators, engineers, plant managers, and executives all need different levels of information to make effective decisions. Using highly configurable dashboards, InsightView allows KPIs and visualizations to be tailored to each role without changing the underlying data model.
For operators and supervisors, dashboards typically focus on real-time status, such as machine state, current OEE, downtime events, and production counts, providing immediate visibility into what is happening on the shop floor. These views help teams respond quickly to issues as they occur.
Engineers and continuous improvement teams often require deeper analytical insight. Their dashboards may emphasize historical trends, loss breakdowns, root-cause analysis, and comparisons across shifts, batches, or assets. This level of detail supports data-driven troubleshooting, process optimization, and performance benchmarking.
At the management and executive level, InsightView dashboards aggregate data across lines, plants, or sites. High-level KPIs such as OEE trends, availability losses, throughput, and quality performance are presented in a concise, visual format that supports strategic planning and informed decision-making, without overwhelming users with unnecessary detail.
Because all dashboards draw from the same trusted data sources, InsightView ensures consistency across roles while still delivering the correct information to the right people at the right time. This flexibility allows organizations to align daily operations with long-term business objectives, all within a single ADISRA platform.
How do I access OEE dashboards, reports, and downtime tools in InsightView?
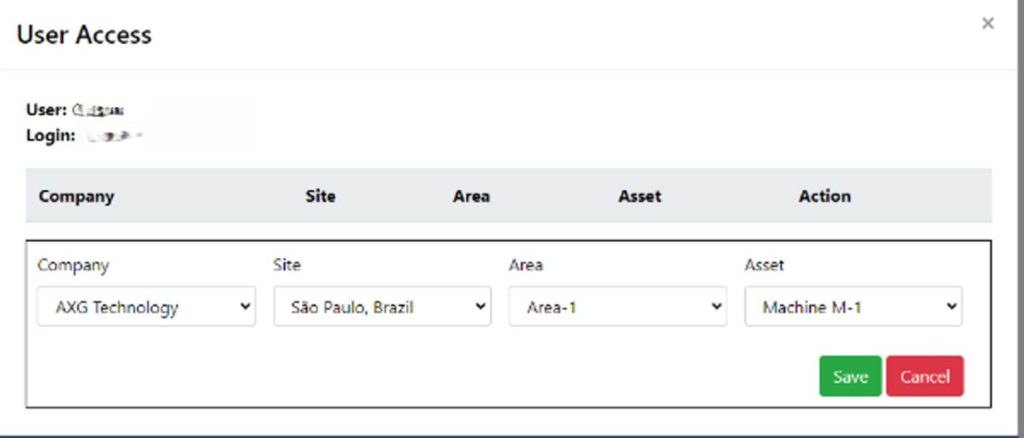
Accessing InsightView’s analytics and management tools begins by selecting the asset you want to analyze. Using the navigation menu, users choose a company, site, area, and then the specific asset they wish to monitor. This hierarchical structure ensures that all analytics and reports are always viewed in the correct operational context.
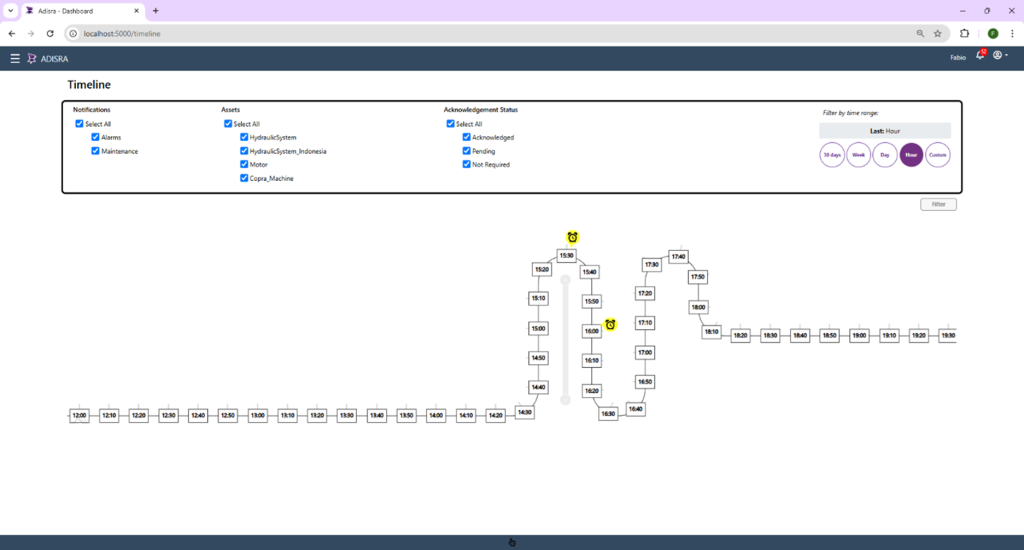
Once an asset is selected, InsightView provides quick access to key tools through an intuitive control bar. From there, users can open Advanced Analytics dashboards, including OEE Overview, Real-Time OEE, and Six Major Losses—along with OEE reports and Downtime Management. This makes it easy to move between real-time monitoring, historical analysis, and downtime tracking without leaving the selected asset view.
By anchoring analytics and reporting to a specific asset, InsightView ensures accuracy, consistency, and clarity, allowing users at every level to quickly access the insights they need to monitor performance, investigate losses, and take action.
From OEE Visibility to Actionable Insight
Overall Equipment Effectiveness is powerful when it moves beyond a single score and becomes a shared, actionable view of performance across machines, plants, and the enterprise. Throughout this Q&A, we have shown how InsightView helps manufacturers turn production data into meaningful insights, connecting assets, databases, analytics, dashboards, and roles into a single, scalable OEE platform.
Whether you are monitoring a single production line or managing performance across multiple sites, InsightView offers the flexibility small-to-mid-market manufacturers need to access powerful analytics without the cost or complexity of building and maintaining their own infrastructure. Delivered through the cloud, InsightView provides secure, company-isolated data access while offering the scalability to grow alongside your business.
The result is faster decision-making, clearer accountability, and a practical, cost-effective path to continuous improvement.
Ready to see InsightView in action?
Watch the full webinar replay to explore InsightView, schedule a private demonstration or training course here, or request a temporary account at info@adisra.com to experience InsightView firsthand. Discover how you can turn OEE data into measurable operational gains and drive continuous improvement across your organization.
ADISRA®, ADISRA’S logo, InsightView®, and KnowledgeView® are registered trademarks of ADISRA, LLC.
© 2025 ADISRA, LLC. All Rights Reserved.